
465 people aged 18 to 24 claimed in the borough in July, against 270 two years ago: the steepest rise of any Kent district, and double the next one.
The number of 18 to 24 year olds claiming unemployment-related benefits in Tonbridge and Malling has risen by 72% in two years, the steepest increase of any district in Kent.
There were 465 claimants in that age group in July 2026, against 350 in July 2025 and 270 in July 2024. Over the same two years the figure rose 17.8% across Kent, 21.7% across the South East and 15.7% across the UK. (ONS claimant count via nomis)
The borough’s headline total tells you almost none of this. It stands at 2,085, or 2.5% of residents aged 16 to 64, up from 1,940 a year ago and 1,870 two years ago.
The number underneath the number
Split the total by age and two things happen at once.
| July | All ages 16+ | Aged 18 to 24 | Aged 25 to 49 |
|---|---|---|---|
| 2024 | 1,870 | 270 | 1,160 |
| 2025 | 1,940 | 350 | 1,100 |
| 2026 | 2,085 | 465 | 1,100 |
The 25 to 49 group, which is much the largest, is down 5.2% over two years. The 18 to 24 group is up 72.2%. A borough total that has moved 11.5% is the sum of one group getting slowly better and a smaller group getting sharply worse.
The other comparison worth making is with the county. Kent’s total claimant count is down 2.6% over the same two years, from 34,410 to 33,515, and the UK’s is down 4.9%. Tonbridge and Malling’s is up. On the headline measure this borough is moving against Kent and against the country.
How the Kent districts compare
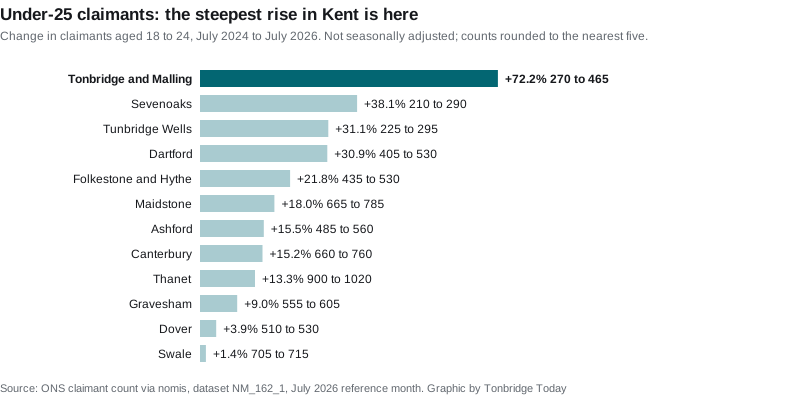
Tonbridge and Malling is not simply at the top of that list. Its rise is nearly double the next district’s. Sevenoaks is second at 38.1%, Tunbridge Wells third at 31.1% and Dartford fourth at 30.9%. At the other end, Swale rose 1.4% and Dover 3.9%.
Over one year rather than two the picture is slightly different, and worth stating because it changes who is first: Sevenoaks rose 34.9% between July 2025 and July 2026, just ahead of Tonbridge and Malling on 32.9%. Gravesham is the only Kent district where the under-25 count fell over the year, by 2.4%.
The west of the county dominates the top of both lists. Tonbridge and Malling, Sevenoaks and Tunbridge Wells are the three districts with the fewest young claimants in absolute terms, and the three with the fastest growth in them.
What the claimant count is, and is not
This matters more than usual here, because the numbers are small and the percentages are large.
- It is not the unemployment rate. The claimant count records people claiming Universal Credit who are required to look for work, plus the remaining Jobseeker’s Allowance claimants. Some of them are working, on low enough earnings to stay in the work-search group.
- It is not seasonally adjusted. July always picks up school and college leavers who have signed on. That is why every comparison above is July against July.
- ONS rounds to the nearest five. On a figure of 270 that rounding is worth about 2%, so read the exact percentages as close approximations rather than precise ones. The direction and the scale of the change are not in doubt; a percentage point either way is.
- It counts claims, not people out of work. Changes to benefit rules or to conditionality can move the count without anyone’s job changing.
What it means for you
If you are 18 to 24 and looking for work in this borough, the figures say something useful and slightly grim: you are competing with about 195 more people in your own age group than someone in your position faced in the summer of 2024, in a place where the over-25 jobs market has been quietly improving.
Two practical points:
- The count is a July figure and July is the worst month for it. School and college leavers are in it. The September and October figures, published in the following months, are the ones to watch for whether this is a seasonal spike on top of a rising trend or the trend itself.
- Support is not run by the borough council. Jobcentre Plus and the Department for Work and Pensions run work-search support, and Kent County Council runs careers and skills provision for young people. The borough council’s part is housing and council tax support.
We will publish the August figure when ONS releases it, and we will keep publishing the age split rather than the headline, because on this evidence the headline hides the story.
Related
- Tonbridge house prices: what the borough’s housing market is doing alongside this.
- Tonbridge and Malling is abolished in 2028: the council reorganisation that changes who runs local services.
Sources
- ONS claimant count, dataset NM_162_1 via nomis, July 2024, July 2025 and July 2026 reference months, for Tonbridge and Malling (E07000115), the eleven other Kent districts, Kent, the South East and the United Kingdom. Figures are for males and females combined, not seasonally adjusted.
- ONS, Claimant count by age group (CLA02) and claimant count by unitary and local authority, the published series behind the nomis figures.
Have your say