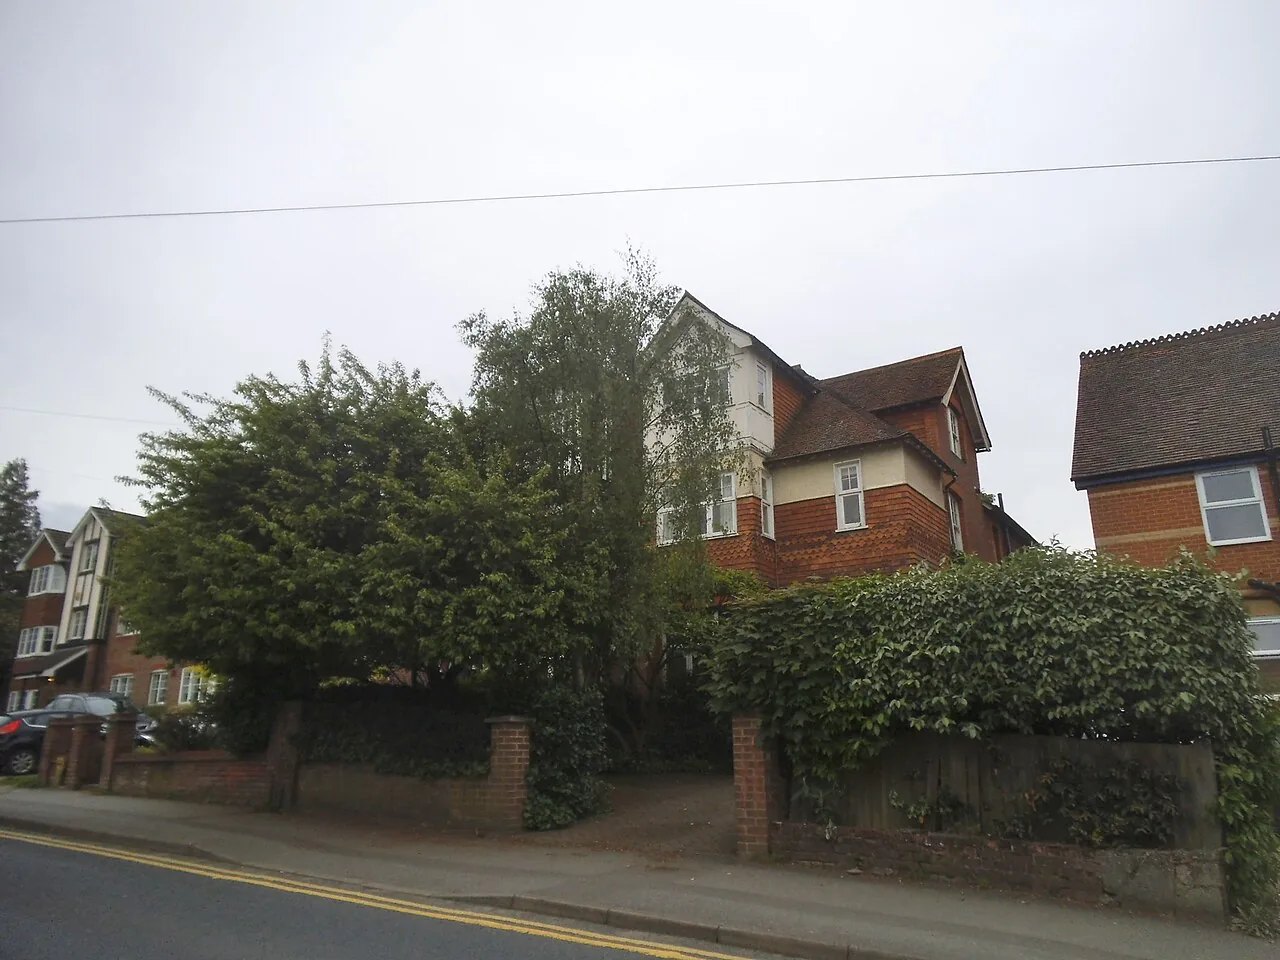

The average Tonbridge and Malling home sold for £407,880 in July 2026, up 1.4% in a year. Median sold prices by postcode area, straight from Land Registry data.
Asking prices in agents’ windows are hopes. The number that counts is what homes actually change hands for, and every completed sale in England and Wales is recorded by HM Land Registry and published. This page reads those records for the Tonbridge and Malling borough: the headline average, how it splits by property type, and what the median home sold for in each part of the borough, from central Tonbridge to Snodland.
One thing to fix before the numbers. Tonbridge and Royal Tunbridge Wells are different towns in different council areas about five miles apart, and their markets are not the same. Everything below is Tonbridge and Malling.
The headline figure
The average home in the Tonbridge and Malling borough sold for £407,880 in July 2026, the most recent month published in the UK House Price Index. That is up 1.4% over the year and up 0.7% on June.
The recovery is real but modest. Prices in the borough peaked at £420,987 in December 2022, so the average home is still about £13,100, or 3.1%, below its peak three years and seven months later. Between then and early 2026 the index fell, flattened and only turned positive again this spring: the annual change was still negative as recently as April 2026 (-0.5%) and March 2026 (-2.1%).
In plain terms, this is a market that has stopped falling rather than one that is running away.
What it means for you
If you are buying, the borough is cheaper in real terms than it was in 2022 and sellers are no longer fielding sealed bids. The gap between areas is wide enough that moving one postcode north or east buys noticeably more house, which is worth testing before you fix on a search area.
If you are selling, the annual figure has only just turned positive. Pricing off a 2022 comparable is the most common reason a Tonbridge house sits.
If you are staying put, your home is roughly where it was at the end of 2022 in cash terms. Whatever it is worth, the yearly running cost that surprises buyers most is the council tax band, so check that before you commit to a move within the borough.
Prices by property type
The average hides a wide spread. These are borough averages for July 2026 from the UK House Price Index, with the annual change alongside:
- Detached houses: £694,607, up 1.0% over the year. The most expensive category by a long way, and the slowest-moving.
- Semi-detached houses: £426,111, up 2.6%. The strongest riser in the borough and, at close to the borough average, the archetypal Tonbridge and Malling home.
- Terraced houses: £344,495, up 1.9%.
- Flats and maisonettes: £222,724, down 1.5%. The only category still falling.
The same data splits buyers rather than buildings. A first-time buyer in the borough paid an average of £326,581 in July 2026, up 1.7% over the year. A home mover paid £482,928, up 1.3%. The £156,000 between those two figures is, in practice, the size of the step from a first flat or terrace to a family house here.
What each part of the borough actually sells for
This is where the borough average stops being useful. Tonbridge and Malling runs from the Medway at Tonbridge to the M20 at Snodland, and the two ends are not one market.
The table below is our own analysis of 1,794 residential sales in the borough that completed between June 2025 and June 2026, taken from HM Land Registry Price Paid data and filtered to sales recorded in the Tonbridge and Malling district. It shows the median price, the middle sale, which is less distorted by one big house than an average is.
| Postcode area | Main places | Median sold price | Sales |
|---|---|---|---|
| TN11 | Hildenborough, Hadlow, Leigh, Golden Green | £499,499 | 120 |
| ME18 | Mereworth and district | £472,500 | 33 |
| TN10 | North Tonbridge (Higham Wood, Cage Green, Trench) | £470,000 | 155 |
| TN15 | Borough Green, Wrotham, Platt, Plaxtol | £470,000 | 172 |
| ME19 | West Malling, Kings Hill, Offham, Ryarsh | £470,000 | 351 |
| TN12 | East Peckham and district | £435,000 | 35 |
| ME5 | Blue Bell Hill and the borough's northern fringe | £392,500 | 53 |
| TN9 | Tonbridge town centre and south | £380,000 | 279 |
| ME20 | Larkfield, Aylesford, Ditton, New Hythe | £375,000 | 333 |
| ME6 | Snodland, Ham Hill | £310,000 | 174 |
| ME1 | Burham, Wouldham | £292,500 | 84 |
The spread is £207,000 between the top and bottom of that table. The pattern is geographical rather than random. The village belt west and north of Tonbridge (Hildenborough, Hadlow, Leigh) is the priciest ground in the borough. The M20 corridor at Snodland, Burham and Wouldham is the cheapest, and it is the reason the borough average sits so far below neighbouring Sevenoaks.
Two details inside those figures are worth pulling out. Kings Hill is a market of its own: the ME19 4 postcode sector, which is essentially Kings Hill, had a median of £550,125 across 140 sales, well above the £470,000 for ME19 as a whole. And Tonbridge splits down the middle: TN9 1, covering the town centre, had a median of £325,000 against £400,000 for TN9 2 to the south and east, and £470,000 for TN10 north of the river.
The same house type, three different prices
Comparing like with like across the borough makes the point more sharply. These are median sold prices for the same June 2025 to June 2026 window:
| Area | Detached | Semi-detached | Terraced | Flat |
|---|---|---|---|---|
| Tonbridge town (TN9 and TN10) | £695,000 | £437,500 | £354,720 | £230,000 |
| Borough Green and Wrotham (TN15) | £790,000 | £475,000 | £385,000 | £196,000 |
| West Malling and Kings Hill (ME19) | £663,500 | £440,000 | £370,000 | £240,000 |
| Larkfield and Aylesford (ME20) | £545,000 | £400,000 | £315,000 | £216,760 |
| Snodland (ME6) | £460,000 | £352,500 | £292,000 | £250,000 |
A detached house in Borough Green costs £330,000 more than a detached house in Snodland. A terrace in Snodland is £93,000 cheaper than the same shape of house in Borough Green. Flats are the exception that proves the point: they barely move across the borough, because a flat is mostly a flat wherever it is.
New-build sales in the borough over the same period had a median of £460,000, above the borough median, which is what you would expect when most of the new supply is houses rather than flats.
How the borough compares
Tonbridge and Malling sits in the middle of its neighbours, and above the county and national averages. All figures are July 2026 from the UK House Price Index.
| Area | Average price | Annual change |
|---|---|---|
| Sevenoaks district | £538,714 | +1.0% |
| Tunbridge Wells borough | £456,227 | +0.6% |
| Tonbridge and Malling borough | £407,880 | +1.4% |
| South East region | £380,878 | +0.2% |
| Maidstone borough | £352,722 | -0.1% |
| Kent county | £346,904 | +1.5% |
| England | £293,479 | +1.1% |
The average home here costs about £61,000 more than the Kent average and £131,000 less than the average in neighbouring Sevenoaks. That Sevenoaks gap is the single most useful number in this page for anyone moving within west Kent: the same money buys a materially larger house one district east, and Tonbridge station is on the same London line.
Frequently asked questions
What is the average house price in Tonbridge?
The average home in the Tonbridge and Malling borough sold for £407,880 in July 2026, according to the UK House Price Index, which is built from completed HM Land Registry sales. Within the borough, median sold prices ranged from £292,500 around Burham and Wouldham to £499,499 in the TN11 villages.
Are Tonbridge house prices going up or down?
Up, slightly, and only recently. Prices were up 1.4% in the year to July 2026, after annual falls as late as April 2026. The borough average is still about 3.1% below its December 2022 peak of £420,987.
How much is a detached house in Tonbridge?
The borough average for a detached house was £694,607 in July 2026. Median sold prices vary widely by area: £695,000 in Tonbridge town, £790,000 around Borough Green and Wrotham, and £460,000 in Snodland.
Is Tonbridge cheaper than Sevenoaks or Tunbridge Wells?
Yes, on the district averages. Tonbridge and Malling at £407,880 sits below Tunbridge Wells (£456,227) and well below Sevenoaks (£538,714), while sitting above Maidstone (£352,722) and the Kent county average (£346,904).
Where are the cheapest places to buy in the borough?
On completed sales over the past year, the lowest medians are in Burham and Wouldham (ME1, £292,500) and Snodland (ME6, £310,000), followed by Larkfield and Aylesford (ME20, £375,000).
How much is a house in Kings Hill?
The ME19 4 postcode sector, which is essentially Kings Hill, had a median sold price of £550,125 across 140 sales completed between June 2025 and June 2026, the highest of any postcode sector we measured in the borough.
Where can I check what a specific house sold for?
Every completed sale in England and Wales is public. Search a street or address for free on the HM Land Registry Price Paid service.
Related
- Tonbridge train times to London and what a season ticket costs, which is the other half of the cost of living here.
- Tonbridge planning news: the 19,746 homes the borough has been told to find, and where they might go.
- Things to do in Tonbridge.
Sources
- UK House Price Index, Tonbridge and Malling (ONS and HM Land Registry) for the borough average, property-type and buyer-type figures and the annual changes.
- HM Land Registry UKHPI open data for the July 2026 record, and the matching Kent, Sevenoaks, Tunbridge Wells, Maidstone, South East and England benchmarks. The December 2022 peak comes from the same series.
- HM Land Registry Price Paid data for the postcode-area and property-type medians, computed from 1,794 residential sales recorded in the Tonbridge and Malling district completing between June 2025 and June 2026.
Land Registry figures are provisional and revised as more sales are registered. Confirm the latest numbers against the linked sources before making a decision.
Have your say